Difference between revisions of "Data Visualization with Java"
(→PTPlot Library) |
(→Other Libraries) |
||
| (13 intermediate revisions by 2 users not shown) | |||
| Line 4: | Line 4: | ||
* Webpage and download: [http://jchart2d.sourceforge.net/index.shtml] | * Webpage and download: [http://jchart2d.sourceforge.net/index.shtml] | ||
| − | JChart2D is an minimalistic realtime charting library published under the OSI approved [http://www.gnu.org/copyleft/lesser.txt GNU LESSER GENERAL PUBLIC LICENSE]. It is designed for displaying multiple traces consisting of tracepoints. JChart2D is centered around a single configureable swing widget: the Chart2D. It is a JComponent one can add to a java swing user interface. Therefore basic knowledge of java awt and swing and the information provided on this site is helpful. If | + | JChart2D is an minimalistic realtime charting library published under the OSI approved [http://www.gnu.org/copyleft/lesser.txt GNU LESSER GENERAL PUBLIC LICENSE]. It is designed for displaying multiple traces consisting of tracepoints. JChart2D is centered around a single configureable swing widget: the Chart2D. It is a JComponent one can add to a java swing user interface. Therefore basic knowledge of java awt and swing and the information provided on this site is helpful. If basic knowledge of swing and awt is given, JChart2D is very easy to understand an to use. |
===Code Examples=== | ===Code Examples=== | ||
| Line 21: | Line 21: | ||
// Create a chart: | // Create a chart: | ||
Chart2D chart = new Chart2D(); | Chart2D chart = new Chart2D(); | ||
| − | // Create an | + | // Create an Trace: |
ITrace2D trace = new Trace2DSimple(); | ITrace2D trace = new Trace2DSimple(); | ||
// Add the trace to the chart: | // Add the trace to the chart: | ||
| Line 42: | Line 42: | ||
which looks like this: | which looks like this: | ||
| − | + | [[Image:JChart2DStaticXYChart.PNG]] | |
== JFreeChart Library == | == JFreeChart Library == | ||
| Line 114: | Line 114: | ||
which looks like this: | which looks like this: | ||
| − | + | [[Image:JFreeChartLineChart.PNG]] | |
== PTPlot Library == | == PTPlot Library == | ||
| − | * License Model: | + | * License Model: Open Source [http://ptolemy.eecs.berkeley.edu/ptIIcopyright.htm UC Berkeley copyright] |
| − | * Webpage and download: [http://ptolemy | + | * Webpage and download: [http://ptolemy.berkeley.edu/java/ptplot5.7/ptolemy/plot/doc/index.htm] |
Ptplot 5.7 is a 2D data plotter and histogram tool implemented in Java. Ptplot can be used as a standalone applet or application, or it can be embedded in your own applet or application. | Ptplot 5.7 is a 2D data plotter and histogram tool implemented in Java. Ptplot can be used as a standalone applet or application, or it can be embedded in your own applet or application. | ||
| Line 178: | Line 178: | ||
which looks like this: | which looks like this: | ||
| − | + | [[Image:PTPlotXYLiveChart.PNG]] | |
== JCCKit Library == | == JCCKit Library == | ||
| Line 185: | Line 185: | ||
* Webpage and download: [http://jcckit.sourceforge.net/] | * Webpage and download: [http://jcckit.sourceforge.net/] | ||
| − | JCCKit is is a | + | The JCCKit is a small (< 100Kb) library and a very flexible framework for creating scientific charts and plots. |
| + | JCCKit is written for the JDK™ 1.1.8 platform (except of a Graphics2D renderer). Thus, it is suitable for scientific Applets and for PDA's running a PersonalJava™ implementation. | ||
| + | The main purpose is to provide a flexible kit for writing applets and application with the need for visualizing scientific data. If you are looking for a lean scientific chart and plot library without all the unwanted bells and whistles of the heavy competitors try JCCKit. | ||
| + | The key features of JCCKit are: | ||
| + | |||
| + | *small (< 100Kb jar file) | ||
| + | *highly configurable due to a sophisticated configuration concept (this makes JCCKit difficult to understand because you have to know how all the parameters are called, and there are a lot of parameters) | ||
| + | *automatic updating if data changes | ||
| + | *automatic rescaling if canvas size changes | ||
| + | |||
===Code Examples=== | ===Code Examples=== | ||
| Line 286: | Line 295: | ||
which looks like this: | which looks like this: | ||
| − | + | [[Image:JCCKitXYChart.PNG]] | |
| − | |||
| − | |||
| − | |||
| − | |||
| − | |||
| − | |||
| − | |||
| − | |||
| − | |||
| − | |||
| − | |||
| − | |||
| − | |||
| − | |||
| − | |||
| − | |||
| − | |||
| − | |||
| − | |||
| − | |||
| − | |||
| − | |||
| − | |||
| − | |||
| − | |||
| − | |||
| − | |||
| − | |||
Latest revision as of 15:23, 10 August 2010
Contents
JChart2D Library
- License Model: open source (LGPL license)
- Webpage and download: [1]
JChart2D is an minimalistic realtime charting library published under the OSI approved GNU LESSER GENERAL PUBLIC LICENSE. It is designed for displaying multiple traces consisting of tracepoints. JChart2D is centered around a single configureable swing widget: the Chart2D. It is a JComponent one can add to a java swing user interface. Therefore basic knowledge of java awt and swing and the information provided on this site is helpful. If basic knowledge of swing and awt is given, JChart2D is very easy to understand an to use.
Code Examples
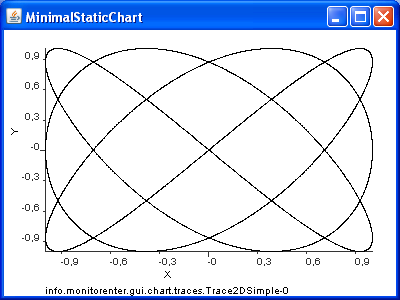
The follwing code snipped creates a static XY Diagramm
import info.monitorenter.gui.chart.Chart2D;
import info.monitorenter.gui.chart.ITrace2D;
import info.monitorenter.gui.chart.traces.Trace2DSimple;
import javax.swing.JFrame;
public class MinimalStaticChart {
private MinimalStaticChart() {
  super();
}
public static void main(String[]args){
  // Create a chart:
  Chart2D chart = new Chart2D();
  // Create an Trace:
  ITrace2D trace = new Trace2DSimple();
  // Add the trace to the chart:
  chart.addTrace(trace);
  // Create the Points and add them to the trace
  for(double i=0;i<=10;i+=0.001){
    trace.addPoint(Math.cos(3*i),Math.sin(4*i));
  }
  // Create a frame.
  JFrame frame = new JFrame("MinimalStaticChart");
  // add the chart to the frame:
  frame.getContentPane().add(chart);
  // make a few adjustments for the Frame
  frame.setSize(400,300);
  frame.setDefaultCloseOperation(JFrame.EXIT_ON_CLOSE);
  frame.setVisible(true);
  }
}
which looks like this:
JFreeChart Library
- License Model: Open Source (LGPL)
- Webpage and download: [2]
JFreeChart is a free 100% Java chart library that makes it easy for developers to display professional quality charts in their applications. JFreeChart's extensive feature set includes:
- a consistent and well-documented API, supporting a wide range of chart types;
- a flexible design that is easy to extend, and targets both server-side and client-side applications;
- support for many output types, including Swing components, image files (including PNG and JPEG), and vector graphics file formats (including PDF, EPS and SVG);
- JFreeChart is "open source" or, more specifically, free software. It is distributed under the terms of the GNU Lesser General Public Licence (LGPL), which permits use in proprietary applications.
Code Examples
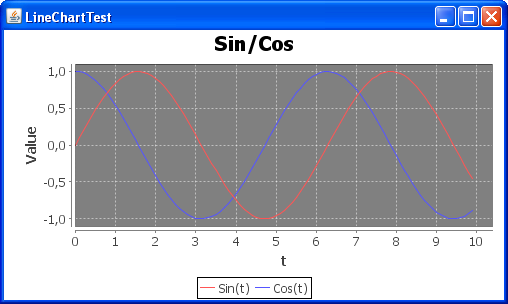
The follwing code snipped creates a static XY Diagramm
import java.awt.Color;
import java.awt.Dimension;
import javax.swing.JPanel;
import org.jfree.chart.ChartFactory;
import org.jfree.chart.ChartPanel;
import org.jfree.chart.JFreeChart;
import org.jfree.chart.plot.PlotOrientation;
import org.jfree.data.xy.XYDataset;
import org.jfree.data.xy.XYSeries;
import org.jfree.data.xy.XYSeriesCollection;
import org.jfree.ui.ApplicationFrame;
import org.jfree.ui.RefineryUtilities;
public class LineChartTest extends ApplicationFrame{
  public LineChartTest(String title){
    super(title);
    XYDataset data = createDataset();
    JFreeChart chart = createChart(data);
    ChartPanel chartPanel = new ChartPanel(chart);
    chartPanel.setPreferredSize(new Dimension(500,270));
    setContentPane(chartPanel);
  }
  //Create Data
  private static XYDataset createDataset(){
    //Create data series and add all the points
    XYSeries data1 = new XYSeries("Sin(t)");
    XYSeries data2 = new XYSeries("Cos(t)");
    for (int i=0;i<100;i++) {
      data1.add(i/10.0,Math.sin(i/10.0));
      data2.add(i/10.0,Math.cos(i/10.0));
    }
    //Create a collection for the series and add them to the collection
    XYSeriesCollection dataset = new XYSeriesCollection();
    dataset.addSeries(data1);
    dataset.addSeries(data2);
    return dataset;
  }
  //Create a Chart with the XYDataset "data" and a few ettings
  private static JFreeChart createChart(XYDataset data){
    //Create a chart with the title "Sin/Cos", the xAxisLable "t", the yAxisLable "Value"
    JFreeChart chart = ChartFactory.createXYLineChart("Sin/Cos", "t", "Value", data, PlotOrientation.VERTICAL, true, false, false);
    chart.setBackgroundPaint(Color.white);
    chart.getPlot().setBackgroundPaint(Color.gray);
    return chart;
  }
  public static void main(String[] args) {
    LineChartTest demo = new LineChartTest("LineChartTest");
    demo.pack();
    RefineryUtilities.centerFrameOnScreen(demo);
    demo.setVisible(true);
  }
}
which looks like this:
PTPlot Library
- License Model: Open Source UC Berkeley copyright
- Webpage and download: [3]
Ptplot 5.7 is a 2D data plotter and histogram tool implemented in Java. Ptplot can be used as a standalone applet or application, or it can be embedded in your own applet or application. Ptplot is a part of Ptolemy II, but Ptplot is also available as a separate download.
Code Examples
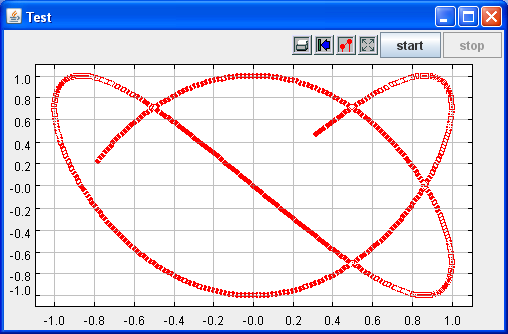
The follwing code snipped creates a non-static XY Diagramm
import java.awt.event.WindowAdapter;
import java.awt.event.WindowEvent;
import javax.swing.JFrame;
import ptolemy.plot.PlotLive;
public class LivePlotTest extends PlotLive{
  public LivePlotTest() {
    //Set the range of the axes
    setYRange(-1, 1);
    setXRange(-1, 1);
    //Set the amount of points on the screen
    setPointsPersistence(500);
    //Set the shape of the points, other possibilities are "points" or "dots"
    setMarksStyle("dots");
  }
  double i = 0;
  public static void main(String[] args) {
    //Create a plot
    final LivePlotTest test = new LivePlotTest();
    //Enable the exit button
    JFrame frame = new JFrame("Test");
    frame.addWindowListener(new WindowAdapter() {
      public void windowClosing(WindowEvent event) {
        test.stop();
        System.exit(0);
      }
    });
    //Make it visible
    frame.add("Center", test);
    frame.setVisible(true);
    //Enable the start and the stop button
    test.setButtons(true);
    //Start the plot
    test.start();
    frame.pack();
  }
  //Create the points and add them to the plot
  public void addPoints() {
    addPoint(0, Math.sin(2*i),Math.cos(3*i), false);
    i+=0.01;
    try{
      Thread.sleep(5);
    }catch(InterruptedException ex){
      ex.printStackTrace();
    }
  }
}
which looks like this:
JCCKit Library
- License Model: open source (LGPL license)
- Webpage and download: [4]
The JCCKit is a small (< 100Kb) library and a very flexible framework for creating scientific charts and plots. JCCKit is written for the JDK™ 1.1.8 platform (except of a Graphics2D renderer). Thus, it is suitable for scientific Applets and for PDA's running a PersonalJava™ implementation. The main purpose is to provide a flexible kit for writing applets and application with the need for visualizing scientific data. If you are looking for a lean scientific chart and plot library without all the unwanted bells and whistles of the heavy competitors try JCCKit. The key features of JCCKit are:
- small (< 100Kb jar file)
- highly configurable due to a sophisticated configuration concept (this makes JCCKit difficult to understand because you have to know how all the parameters are called, and there are a lot of parameters)
- automatic updating if data changes
- automatic rescaling if canvas size changes
Code Examples
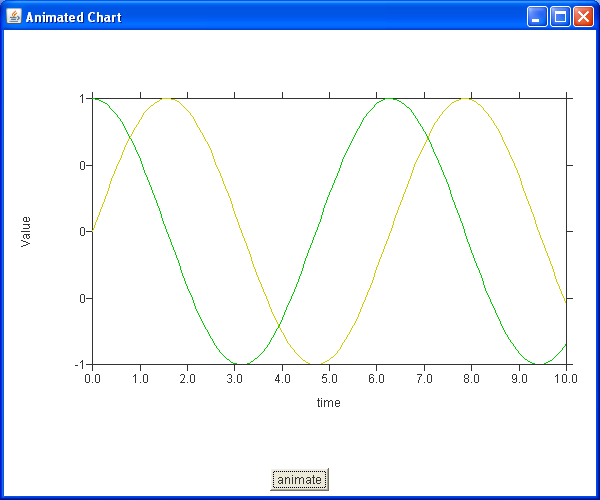
The follwing code snipped creates a static XY Diagramm
import java.applet.Applet;
import java.awt.BorderLayout;
import java.awt.Button;
import java.awt.Color;
import java.awt.Panel;
import java.awt.event.ActionEvent;
import java.awt.event.ActionListener;
import java.util.Properties;
import javax.swing.JFrame;
import jcckit.GraphicsPlotCanvas;
import jcckit.data.DataCurve;
import jcckit.data.DataPlot;
import jcckit.data.DataPoint;
import jcckit.util.ConfigParameters;
import jcckit.util.PropertiesBasedConfigData;
public class JCCKitTest extends Applet {
  private DataPlot _dataPlot;
  public void init() {
    GraphicsPlotCanvas plotCanvas = createPlotCanvas();
    //Create a new dataPlot
    _dataPlot = new DataPlot();
    _dataPlot.addElement(new DataCurve(""));
    //Show it on the screen
    plotCanvas.connect(_dataPlot);
    setLayout(new BorderLayout());
    add(plotCanvas.getGraphicsCanvas(), BorderLayout.CENTER);
    add(createControlPanel(), BorderLayout.SOUTH);
  }
  private GraphicsPlotCanvas createPlotCanvas() {
    //Adjustments:
    Properties props = new Properties();
    ConfigParameters config = new ConfigParameters(new PropertiesBasedConfigData(props));
    props.put("plot/legendVisible", "false");
    props.put("plot/coordinateSystem/xAxis/minimum", "0");
    props.put("plot/coordinateSystem/xAxis/maximum", "10");
    props.put("plot/coordinateSystem/xAxis/axisLabel", "");
    props.put("plot/coordinateSystem/xAxis/ticLabelFormat/map", "%d");
    props.put("plot/coordinateSystem/yAxis/axisLabel", "growth rate");
    props.put("plot/coordinateSystem/yAxis/maximum", "1");
    props.put("plot/coordinateSystem/yAxis/minimum", "-1");
    props.put("plot/coordinateSystem/yAxis/ticLabelFormat", "%d");
    props.put("plot/curveFactory/definitions", "curve, curve2");
    props.put("plot/curveFactory/curve/withLine", "true");
    props.put("plot/curveFactory/curve/symbolFactory/className", "jcckit.plot.CircleSymbolFactory");
    props.put("plot/curveFactory/curve/symbolFactory/attributes/className", "jcckit.graphic.ShapeAttributes");
    props.put("plot/curveFactory/curve/symbolFactory/attributes/fillColor", "0xfe8000");
    props.put("plot/curveFactory/curve/symbolFactory/attributes/lineColor", "0");
    props.put("plot/curveFactory/curve/symbolFactory/size", "0.01");
    props.put("plot/initialHintForNextCurve/className", "jcckit.plot.PositionHint");
    props.put("plot/initialHintForNextCurve/position", "0 0.1");
    return new GraphicsPlotCanvas(config);
  }
  private Panel createControlPanel() {
    Panel controlPanel = new Panel();
    Button startButton = new Button("start");
    //Starts to plot the chart
    startButton.addActionListener(new ActionListener() {
              public void actionPerformed(ActionEvent e) {
                new Thread() {
                        public void run() {
                          animate();
                        }
                      }.start();
              }
            });
    controlPanel.add(startButton);
    return controlPanel;
  }
  private void animate() {
    //Create Points and add them to the dataPlot
    DataCurve curve = new DataCurve("");
    DataCurve curve2 = new DataCurve("");
    for (int i = 0; i <= 100; i++) {
      //x=i/10.0 , y=sin(i/10.0)
      curve.addElement(new DataPoint(i/10.0, Math.sin(i/10.0)));
      //x=i/10.0 , y=cos(i/10.0)
      curve2.addElement(new DataPoint(i/10.0, Math.cos(i/10.0)));
    }
    _dataPlot.addElement(curve);
    _dataPlot.addElement(curve2);
  }
  public static void main(String[] args) {
    JFrame frame = new JFrame("Animated Chart");
    frame.setDefaultCloseOperation(JFrame.EXIT_ON_CLOSE);
    Applet applet = new JCCKitTest();
    applet.init();
    applet.setBackground(Color.white);
    frame.add(applet);
    frame.setSize(600, 500);
    frame.setVisible(true);
  }
}
which looks like this:


